A proposed seawater air conditioning plant in Honolulu, Hawaii will draw cold seawater from the deep ocean, and a potential agricultural resource with it: phosphorus.
Credit: Sam Kimbrel
By Alexandra Branscombe
WASHINGTON, DC – Discharged seawater pumped from the ocean and used for a renewable air conditioning system would overload surface waters with minerals that could potentially be captured instead for use in agriculture, according to a noted oceanographer.
Pumps designed to move thousands of tons of water from the sea floor to a proposed Honolulu air-conditioning plant would bring up phosphates located hundreds of feet below the ocean surface, David Karl told an audience of scientists, ocean-policy experts, and students on March 13 at the Smithsonian National Museum of Natural History in Washington, D.C.
When phosphate-rich water is discharged, the sudden availability of the nutrient at the ocean surface is known to cause rapid growth and reproduction of phytoplankton, which can change water transparency and color, and impact marine ecosystems. But instead of being discharged into the ocean, the mineral could be extracted and used as fertilizer by local farmers, Karl said.
“Development of a marine-based, phosphate-capture and reuse process is a major contemporary challenge for science, society, and sustainability,” said Karl, who is a professor of oceanography at the University of Hawaii at Manoa, in Honolulu. He discussed the plant during his 2014 Roger Revelle Commemorative Lecture as an example of solving a sustainability challenge using oceanographic research.
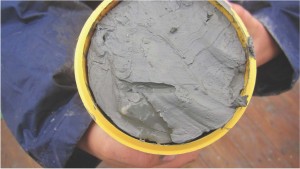
Farmers around the world are facing an impending shortage of terrestrial phosphate, which is mainly used as an agricultural fertilizer, Karl noted. However, the ocean is a rich reservoir of dissolved phosphate. Marine microbes, such as phytoplankton, take in phosphorus and then sink to the depths when they die. As a result, deeper ocean water contains phosphate in higher concentrations than surface water. The only difficulty is finding a method to access the low-lying phosphate and then concentrate it into mineral form, Karl said.
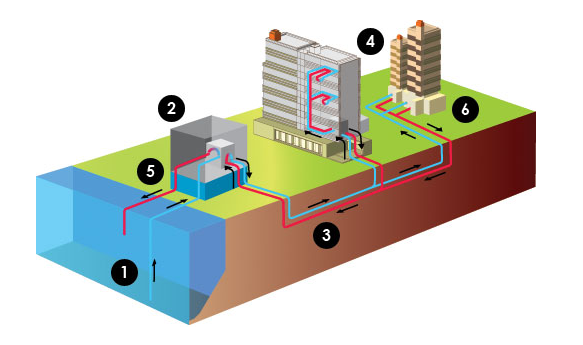
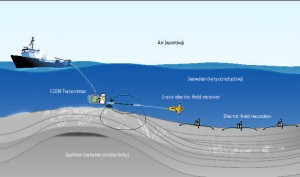
The sea water air conditioning plant will use deep ocean water to cool freshwater that will be cycled through downtown buildings as a sustainable air conditioning technology.
Photo Credit: OTEC
The proposed seawater air conditioning plant could be a test bed for solving the looming phosphate shortage and making seawater-based air-conditioning more environmentally friendly, he added. Unlike conventional air conditioning, the proposed plant could help Honolulu use less fossil fuel and conserve fresh water by recycling it within the system, Karl said.
Cold seawater drawn from more than 1,700 feet below sea level would be used to cool freshwater at the plant. The system would then pump the low-temperature freshwater into city buildings with existing chilled-water air-conditioning systems. Meanwhile, it would return used seawater to the ocean.
Karl said that his early field research has shown that removing phosphate from the seawater used in such a plant before discharging the effluent would prevent phytoplankton blooms.
The chief science adviser of Ocean Thermal Energy Conversion, a company contributing part of the cooling technology for the Honolulu plant, downplayed ecological concerns from discharging the plant’s used seawater. The plant would discard it through a diffuser system offshore and in deep water so as not to greatly affect surface waters or coral communities, said Stephen Oney, in a separate interview.
Karl gave his talk as the latest in a long-standing series of lectures in honor of famed oceanographer Roger Revelle, and created by the Ocean Studies Board of the National Research Council. The series focuses on the connection between ocean sciences and public policy. Revelle served as president for AGU’s Ocean Sciences section from 1956 until 1959.
– Alexandra Branscombe is a science writing intern in AGU’s Public Information department